
When your support tools slow down productivity instead of boosting it, convincing leadership to invest in better systems requires more than complaints – it demands data. Here’s how you can build a solid case for change:
- Audit Your Tools and Workflows: Identify underused tools, redundant processes, and bottlenecks. For example, unused licenses or slow-loading systems can waste time and increase costs.
- Track Key Metrics: Focus on numbers like Mean Time to Resolution (MTTR), Average Handle Time (AHT), and ticket deflection rates. These metrics highlight inefficiencies and their financial impact.
- Quantify Costs: Calculate hidden costs like manual processes, turnover, and wasted time. For instance, a 100-agent team can lose $1 million annually to manual after-call work.
- Show ROI: Use conservative projections to estimate savings from upgraded tools. AI-powered systems can cut ticket costs from $15–$25 to under $2 and reduce resolution times significantly.
- Present to Leadership: Frame your argument around time savings, cost reductions, and improved scalability. Use visuals to compare current inefficiencies with potential gains.
5-Step Process to Prove Tool Inefficiency to Leadership with Key Metrics
How to Prove Salesforce ROI to Your CEO
sbb-itb-e60d259
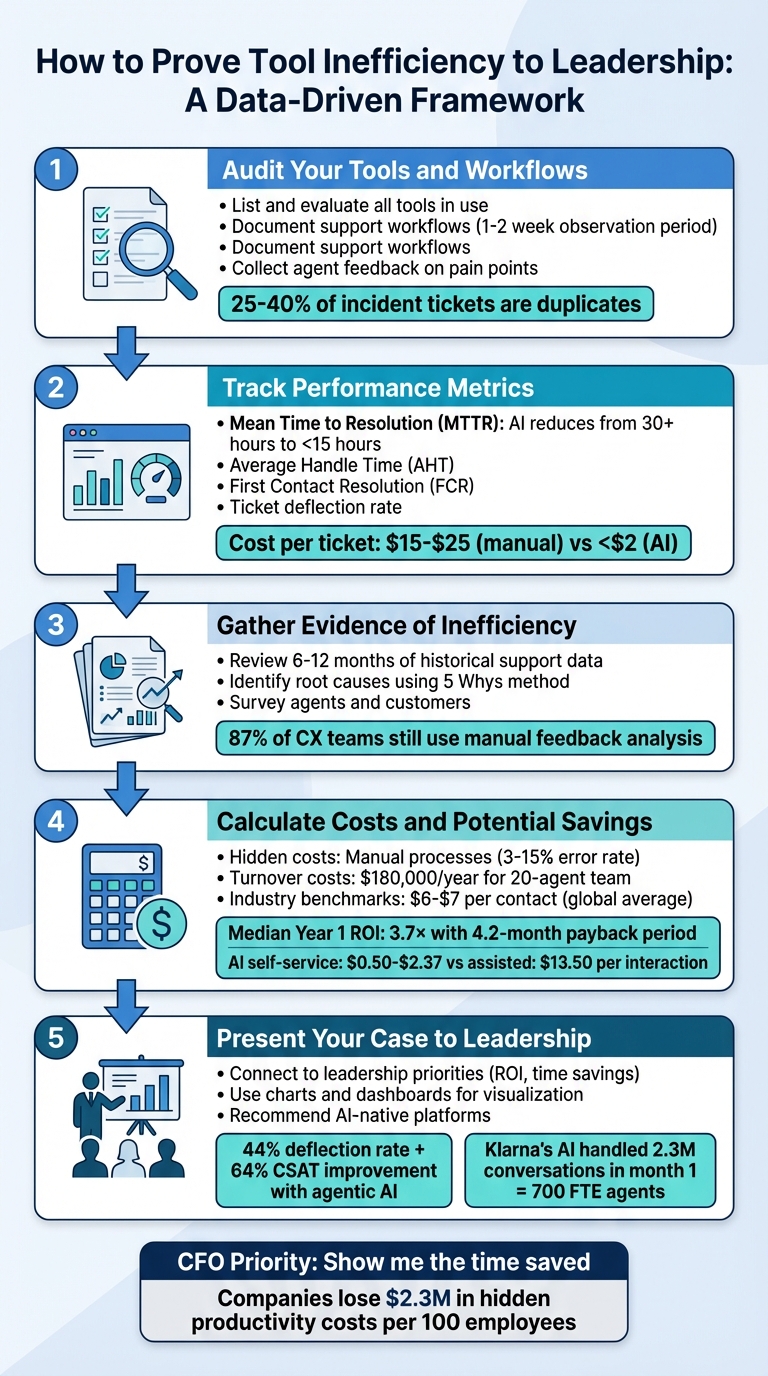
Step 1: Audit Your Current Tools and Workflows
To address inefficiencies, you first need a clear picture of your current operations. Start by thoroughly documenting workflows and tools. This groundwork is crucial for presenting a strong case to leadership. Begin with a complete inventory of every tool your team uses – help desk software, CRM systems, chat platforms, knowledge bases, and any integrations between them. Compare the number of licenses you’re paying for with actual usage. Many teams find they’re paying for tools that go unused, with underutilized licenses adding unnecessary costs [7]. These insights will set the stage for deeper analysis in the next steps.
List and Evaluate All Tools in Use
Create a detailed map of your tech stack, focusing on high-traffic tools. Track how frequently each application is accessed and how much time employees spend using it. This will help you identify which tools are essential and which may be redundant, offering opportunities to cut costs. A helpful metric here is the output-to-input ratio: calculate the value of resolved tickets compared to the combined cost of agent hours and software fees [7]. If the ratio is low, it’s a sign that your tools may not be delivering enough value.
Document Your Support Workflows
Break down your ticket resolution process step by step, from intake to closure. Spend 1–2 weeks shadowing agents to measure how long each step takes [8]. Review system logs to pinpoint where delays occur. For example, if agents frequently wait for a secondary system to load customer data, those delays can add up significantly over time. Categorize tasks by complexity: repetitive, low-complexity tasks like password resets are ideal candidates for automation, while more complex, high-touch issues require human input [8]. This detailed breakdown will reveal bottlenecks and quantify how much time they consume.
Collect Agent Feedback on Pain Points
Ask your team about specific frustrations, such as slow system performance, missing integrations, or excessive manual processes. Cross-check their feedback with objective data from system logs [8]. For instance, agents may overlook "invisible" tasks like scanning for duplicate tickets, which can inflate perceived workloads. Incident-related tickets often have duplication rates between 25% and 40%, adding unnecessary volume [9]. Use a 2–4 week sampling period where agents manually tag recurring issues like "duplicate", "system lag", or "missing info" to quantify these inefficiencies [9]. Combining agent feedback with hard data gives you a comprehensive view of operational pain points. This information will guide your performance metrics and cost analysis in future steps.
"What starts as a minor inefficiency in one department can ripple throughout your organization, draining time, resources, and employee satisfaction." – Brianna Blacet, Content Marketing Manager, Moveworks [7]
Step 2: Track Performance Metrics That Show Inefficiency
Once you’ve audited your tools and workflows, the next step is to quantify inefficiencies by focusing on specific performance metrics. Leaders rely heavily on measurable data, so choosing the right metrics is key to identifying where tools fall short and understanding the costs of those shortcomings.
Choose Metrics That Highlight Problems
Start by tracking Mean Time to Resolution (MTTR) – the average time it takes to resolve an issue from the moment it’s reported. If your MTTR is high, it’s a clear sign of inefficiencies slowing down your team. For example, without AI, the average MTTR often exceeds 30 hours, but AI-enabled teams can bring that down to under 15 hours [11]. Another key metric is Average Handle Time (AHT), which measures how long agents spend resolving individual tickets. A combination of high AHT and low First Contact Resolution (FCR) often indicates tools that make it harder for agents to access the information they need, leading to unnecessary escalations [7][11][12].
Also, monitor approval wait time, which can reveal bottlenecks caused by siloed communication tools like email instead of integrated workflows [11]. Finally, look at your ticket deflection rate, which measures how many customer inquiries are resolved through self-service options. A low ticket deflection rate could point to outdated or poorly organized documentation that customers struggle to navigate [12][3].
Quantify the Financial Impact
To make these metrics resonate with leadership, translate them into financial terms. For instance, calculate Cost Per Ticket by dividing total support costs by the number of tickets resolved. On average, human-handled support interactions cost between $6 and $20, though some organizations report costs as high as $15 to $25 when factoring in agent time, tools, and overhead [2][12]. Comparatively, companies using basic AI tools report costs around $18 to $19 per ticket, while those leveraging more advanced AI systems can reduce this to $15 [3][4].
Assess how your team’s output compares to the combined costs of agents and tools. A low ratio of output to cost signals that your tools may not be delivering sufficient value. These financial insights can help underscore the need for better systems.
Use AI Analytics to Spot Patterns
AI analytics can take your metrics a step further by identifying inefficiencies and predicting future problems. Unlike manual quality assurance, which typically reviews only 1–2% of calls, AI can monitor 100% of customer interactions for quality and compliance [13]. It can also uncover "knowledge gaps" by analyzing support tickets in real-time, flagging recurring questions that aren’t addressed in your self-service documentation [12].
Predictive analytics adds even more value by identifying potential problems before they escalate, such as churn risks or unresolved issues. For example, in 2025, Virgin Money introduced an AI-powered assistant named "Redi" through its mobile app, developed in partnership with IBM Consulting. By 2025, Redi had managed over 2 million interactions with an impressive 94% customer satisfaction rate [15].
Tie your metrics to business outcomes like reducing churn or improving cost-to-serve efficiency to make them actionable for leadership [14].
"If you ask a CFO what ROI metric they want from AI, the answer is almost always the same: ‘Show me the time saved.’" – Alan Knox, Measuring Time Savings from AI Agents [8]
Step 3: Gather Evidence of Inefficiency
Metrics alone rarely sway leadership. To make a compelling case, you need solid evidence that connects tool limitations directly to operational challenges. Once you’ve established clear metrics, the next step is to dig deeper – use historical data and feedback to uncover the root issues.
Review Historical Support Data
Start by diving into your support ticket history to spot patterns that point to recurring problems. For instance, look at resolution time trends over the past 6–12 months. Are certain issues, like password resets or access requests, consistently taking too long to resolve? If these types of tickets keep popping up, it could mean your tools aren’t learning from past resolutions, forcing teams to handle the same questions repeatedly without automation [1].
You’ll also want to examine escalation rates and ticket abandonment. If customers frequently abandon conversations or agents escalate issues more often than expected, it might signal that your current tools make it difficult to find information or properly route requests. Modern AI solutions can analyze historical interactions on a deeper level, helping you identify inefficiencies that manual reviews might miss. This kind of data provides a clear starting point for diagnosing the root causes of operational pain points.
Identify Root Causes
Once you’ve identified recurring patterns, dig into the reasons behind them. Tools like the 5 Whys or fishbone diagrams can help you trace these inefficiencies to their origins. For example, if approval wait times average 12 hours, ask why: Are requests lost in email threads? Do agents lack visibility into approval statuses? Or is there no automated system for routing approvals?
Take loanDepot’s experience in 2023 as an example. They discovered that approval requests sent via email were taking nearly a week to process. The root cause? Fragmented communication tools. By introducing a conversational AI copilot in Microsoft Teams, they slashed approval times to under 5 minutes [11]. Identifying whether your challenges stem from poor integrations, lack of automation, or siloed data can guide you toward actionable solutions. Combining these insights with direct feedback makes your case even stronger.
Survey Agents and Customers
Data alone doesn’t tell the whole story; feedback fills in the gaps. Surveys can reveal frustrations that metrics might overlook. Ask agents specific questions about their pain points: Which tasks are the most time-consuming? Where do they get stuck? Which tools slow them down?
On the customer side, automated sentiment analysis can help uncover hidden issues in interactions. Surprisingly, 87% of CX teams still rely on manual methods to analyze qualitative feedback, leaving critical trends buried [16]. Automating these processes can surface actionable insights, giving you a more complete picture of where inefficiencies lie and how they affect both agents and customers.
Step 4: Calculate Costs and Potential Savings
This step is all about turning inefficiencies into numbers. By calculating the financial impact of outdated tools, you can demonstrate the true cost of sticking with the status quo versus the potential savings from upgrading. It’s no longer just about pointing out problems – it’s about showing leadership exactly how much those problems are costing and how much could be saved.
Add Up Hidden Costs
Operational inefficiencies come with a hefty price tag. For example, manual processes often bring a 3–15% error rate, leading to extra work and coordination headaches [10]. High turnover rates are another major drain: customer service teams typically see a 45% annual turnover rate, costing around $180,000 annually for a 20-agent team when you factor in recruiting, onboarding, training, and overtime expenses [18]. Then there’s the opportunity cost – when skilled employees are stuck on repetitive tasks instead of focusing on strategic priorities, the business loses out [10].
To get the full picture, include all related costs:
- Salaries plus benefits (20–30% of base pay)
- Workspace and infrastructure (10–15%)
- Management overhead (5–10%)
Many companies underestimate their true support costs by 30–40%. On average, organizations lose $2.3 million in hidden productivity costs for every 100 employees, with 67% of these costs slipping past traditional accounting methods [17][10].
Once you’ve tallied these hidden costs, compare them to industry standards to highlight where inefficiencies are hitting hardest.
Compare Against Industry Standards
After identifying hidden costs, sizing them up against industry benchmarks can reveal just how much money is being left on the table. Globally, customer support costs average about $6–$7 per contact, though this varies widely depending on the industry and complexity [21]. For example:
- B2B SaaS companies: $25–$35 per ticket
- Retail: $2.70–$12 per ticket
- High-tech products: $28–$35 per ticket [1][21]
Assisted channels (like phone, chat, or email) are far more expensive than self-service options. Assisted interactions cost about $13.50 each, compared to just $1.84 for self-service [20]. If your tools don’t support effective self-service, you could be spending up to seven times more per interaction. AI-powered self-service is even cheaper, with costs ranging from $0.50 to $2.37 per resolution – an 85–98% reduction compared to assisted channels [1].
Metrics like average handle time (AHT) and first contact resolution (FCR) can also highlight inefficiencies. For instance, password reset tickets often cost around $12, but Level 1 support benchmarks suggest this should be $6–$12. With AI, these tickets could be resolved for under $1, making the gap crystal clear. Many companies adopting AI platforms report that 40–60% of tickets are deflected within the first 90 days, translating into immediate savings [1].
Project Return on Investment
Now, it’s time to model the potential gains. To estimate productivity savings, multiply the average time saved per interaction by the total number of interactions, then factor in your fully loaded agent cost per hour [2]. For deflection savings, calculate how many inquiries AI could handle and multiply that by the cost of a human-handled interaction [2].
Customer support automation often delivers a median Year 1 ROI of 3.7×, with most companies seeing a payback period of just 4.2 months [19]. Use sensitivity analysis (e.g., assuming 50–85% automation) to validate your projections [19]. Don’t forget to include total cost of ownership in your calculations, such as:
- Initial implementation costs: $8,000–$62,000
- Annual API costs: Median $3,600
- Ongoing maintenance: $2,000–$12,000 [19]
Even conservative estimates usually show the financial benefits of upgrading to AI solutions.
"We developed a comprehensive cost model that revealed $8.7M in hidden productivity costs. AI implementation had a 340% ROI when we included all hidden costs."
- Dr. Michael Chen, COO of EfficiencyFirst Corp [10]
These numbers make a compelling case for transitioning to AI-native support tools.
Step 5: Present Your Case to Leadership
You’ve done the groundwork – gathered the data, crunched the numbers, and pinpointed the savings. Now, it’s time to present your findings in a way that leadership simply can’t overlook.
Connect to Leadership Priorities
When presenting to leadership, focus on what matters most to them: the bottom line. For example, instead of saying agents save 2.2 hours per week, frame it as a 25% boost in volume capacity without increasing headcount or a 0.5% reduction in churn.
"If you ask a CFO what ROI metric they want from AI, the answer is almost always the same: ‘Show me the time saved.’" – Alan Knox [8]
ROI is the star of the show. While revenue gains from AI might take months to materialize, productivity improvements often emerge within weeks [8]. If leadership worries about quality, bring data to the table. A quality scorecard comparing current performance metrics – like CSAT, FCR, or error rates – against baseline numbers can show that efficiency doesn’t come at the expense of customer satisfaction [8].
It’s also crucial to address the "automation paradox." Inefficient tools can end up consuming more time, as agents have to double-check the system’s output. Highlight the difference between agentic AI, which autonomously handles tasks like refunds or updates, and non-agentic AI, which provides information but still requires human intervention. The stats speak for themselves: companies using agentic AI report a 44% deflection rate and a 64% improvement in CSAT, while 62% of those using non-agentic systems see no improvement – or worse, rising costs per resolution [3].
This sets the stage for visualizing your data with compelling charts and dashboards.
Use Charts and Dashboards
Visuals can make your case more persuasive. Start with a simple benchmarking chart that compares your current cost-per-ticket to industry standards. For example, if your team spends $35 per ticket (within the $25–$35 industry range), and AI-powered self-service can reduce that cost to $0.50–$2.37, the savings become impossible to ignore [1].
If you’ve run a pilot program, use A/B testing dashboards to show results. For instance, in February 2024, Klarna’s AI assistant managed 2.3 million conversations in its first month, handling two-thirds of all support chats. This slashed average resolution times from 11 minutes to under 2 minutes and provided the equivalent capacity of 700 full-time agents [8].
Another powerful visual? Highlight wasted time. For example, if manual logging adds 90 seconds per ticket and you handle 50,000 tickets annually, that’s 1.25 million minutes – or 20,833 hours – lost every year [5]. Use charts to show how saved time could be reallocated to tasks like proactive outreach or strategic planning. Keep it simple by offering tiered forecasts: a "Conservative" scenario (20–30% time savings) and an "Optimistic" one (40–60% savings) [8].
Once you’ve made the case for change, it’s time to recommend a solution.
Recommend AI-Native Platforms
The inefficiencies you’ve highlighted are exactly what AI-native platforms are built to solve. These systems streamline workflows, reduce manual oversight, and offer a cost-efficient upgrade to outdated tools. Platforms like Supportbench are specifically designed with integrated automation and intelligence, offering features such as:
- Predictive CSAT: Detects unhappy customers early, allowing for proactive interventions [2].
- Dynamic SLAs: Automatically prioritizes tasks based on customer health scores and contract terms, eliminating bottlenecks [2].
- Intelligent Auto-Tagging and Categorization: Ensures tickets are routed correctly the first time, reducing errors in manual workflows [2].
Position AI as a "Copilot" rather than a replacement. This framing reassures leadership that AI empowers employees instead of threatening their roles. For example, in 2025, Grammarly adopted Forethought’s agentic AI, achieving a deflection rate increase from 60% to 87% and tripling their CSAT to 4.2/5. At the same time, their support team could focus on more complex, high-value interactions [3].
"A wrong answer delivered by an automated system could lead to disastrous results… The reputational and financial damage could far outweigh any perceived savings." – Nooshin Alibhai, Founder and CEO, Supportbench [2]
Agentic AI is the future. Unlike basic chatbots, which simply deflect tickets, agentic platforms like Supportbench can handle complex workflows across disconnected systems [3][7]. This ensures comprehensive ticket resolution, reducing costs to around $15 per resolution compared to $18 for non-agentic systems. Plus, 72% of companies using agentic AI report actual cost reductions [3].
Finally, tie your recommendation to Knowledge-Centered Service (KCS). AI-native platforms simplify KCS by automatically generating knowledge base articles from resolved cases [2]. This creates a feedback loop where improved knowledge drives even greater efficiency.
Conclusion
Convincing leadership of tool inefficiency requires a solid, data-backed argument centered on cutting costs, improving scalability, and delivering measurable ROI. By following the five key steps – auditing current tools, tracking performance metrics, gathering evidence, calculating costs, and presenting findings effectively – you can turn operational challenges into actionable solutions.
The trick is to make the invisible visible. Translate everyday inefficiencies like manual logging, redundant tasks, and repetitive workflows into concrete numbers. For instance, highlight the over $1 million lost annually due to wasted time [5], or the 2.2 hours per week that agents could reclaim with better tools [8]. Show how inefficient systems tie ticket volume directly to headcount costs, while AI-native platforms eliminate that dependency. This kind of analysis makes the business case impossible to ignore [6] and demonstrates the rapid productivity improvements leadership values.
CFOs prioritize time savings above all else [8]. While revenue gains from new tools might take months to appear, productivity boosts often show results within weeks. Use pilot data from A/B testing to emphasize a quick payback period, and stick to conservative estimates like 20–30% time savings with a clear timeline for ROI.
Don’t overlook quality concerns, either. Support your case with metrics like CSAT, FCR, and error rates. Point out that AI-powered tools don’t just deflect tickets – they resolve them fully, with 72% of companies reporting major cost savings compared to systems requiring human follow-ups [3]. Frame AI as a collaborative tool that enhances your team’s capabilities, not as a replacement.
Armed with the right data, a clear narrative, and alignment with leadership’s priorities, you can turn skepticism into confident decision-making.
FAQs
Which metrics prove our support tools are slowing us down?
When evaluating your support tools, certain metrics can uncover potential shortcomings:
- Mean Time to Resolution (MTTR): If your MTTR is on the higher side, it could point to delays caused by tools that are outdated or cumbersome to use.
- Support Cost per Ticket: Rising costs per ticket often signal inefficiencies in your support processes or tools.
- Ticket Duplicates and Deflection Rate: A high number of duplicate tickets or a low deflection rate may indicate that your tools aren’t effectively managing or reducing your team’s workload.
Keeping a close eye on these metrics can highlight where your tools might be falling short and justify the case for improvements.
How do I calculate the real cost of manual support work?
To figure out the real cost of manual support work, you need to account for all related expenses – not just agent salaries. Include factors like salaries (which often make up 60–80% of total costs), software, overhead, and training. Once you have the total, divide it by the number of resolved tickets.
For example, if your monthly support expenses total $45,000 and you resolve 1,500 tickets, your cost per ticket would be $30. This calculation can help pinpoint inefficiencies and improve your support operations.
What’s the fastest way to show ROI from an AI-native upgrade?
The fastest way to showcase the return on investment (ROI) from an AI-native upgrade is by highlighting measurable efficiency gains. For instance, you can track time saved per agent or team, which directly impacts productivity. Metrics like reduced average handling time or higher ticket throughput can reveal noticeable improvements in just a few weeks.
Another compelling approach is to compare the cost of AI-driven resolutions against the expenses of handling tickets manually. This comparison often highlights clear financial advantages. By leveraging real-time data and results from pilot programs, you can present these benefits effectively to leadership, making a strong case for the upgrade.