

If you’re still relying on CSAT to measure your customer experience (CX) success, you’re missing the bigger picture. While CSAT gauges customer sentiment in the moment, it doesn’t show the financial impact of your CX efforts. Here’s the key takeaway: focus on metrics that directly link to revenue, retention, and cost savings.
Key metrics to track ROI of CX improvements:
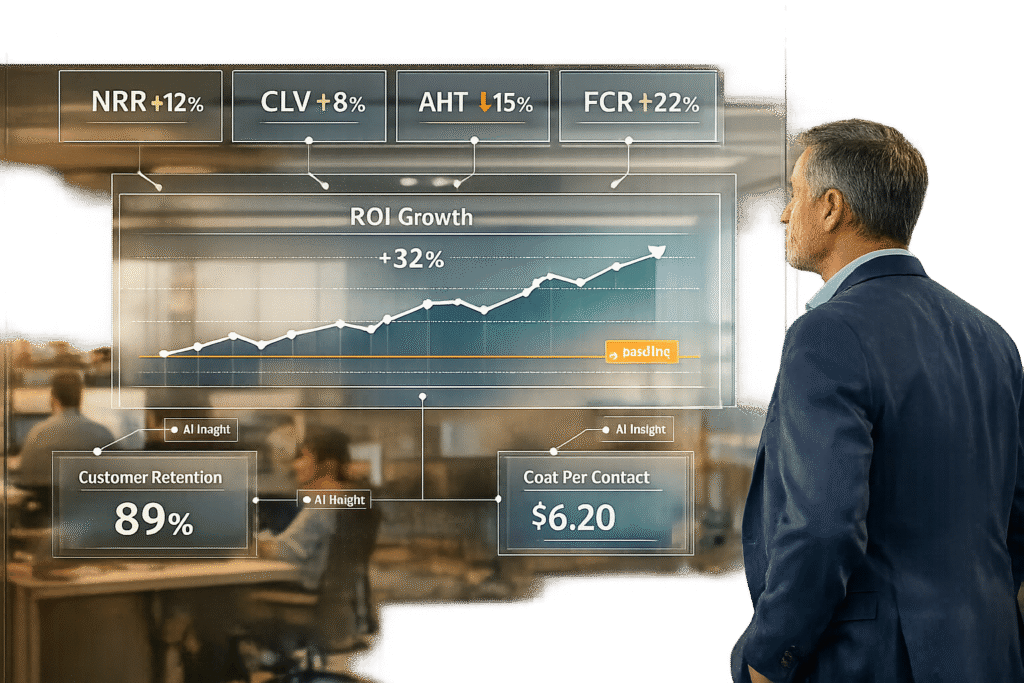
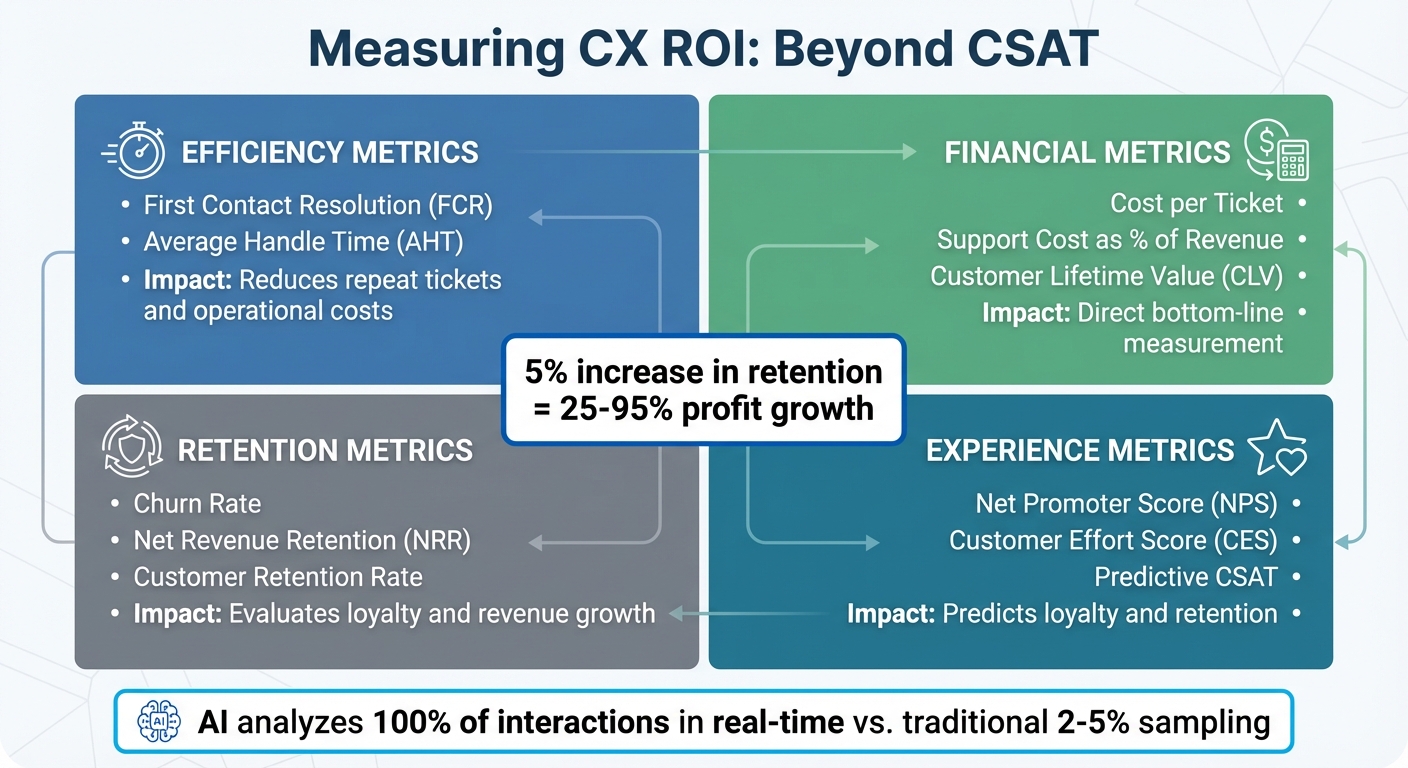
- Efficiency: First Contact Resolution (FCR) and Average Handle Time (AHT) to reduce repeat tickets and operational costs.
- Financial: Cost per Ticket, Support Cost as a Percentage of Revenue, and Customer Lifetime Value (CLV).
- Retention: Churn Rate and Net Revenue Retention (NRR) to evaluate customer loyalty and revenue growth.
- Experience: Net Promoter Score (NPS) and Customer Effort Score (CES) to predict loyalty and retention.
Why AI is a game-changer:
AI tools analyze 100% of customer interactions in real time, providing insights into sentiment, intent, and efficiency. This eliminates sampling bias and connects CX improvements to measurable financial outcomes like saved revenue and operational savings.
Quick example:
A B2B SaaS company reduced support costs from 12% to 7% of revenue, achieving a 320% ROI in two years by focusing on metrics like AHT and FCR.
The bottom line? Measuring CX ROI means shifting from sentiment scores to metrics that directly impact your bottom line. Start by setting a baseline, track actionable metrics, and leverage AI for deeper insights.
CX ROI Metrics Framework: 4 Key Categories to Track Customer Experience Impact
Prove The ROI of Customer Experience (WITH ACTUAL MATH!)
Setting Up Your Baseline CX Metrics
Think of a baseline as your "before" snapshot – a clear picture of where your support operations stand right now. Without this, it’s impossible to know if your efforts are actually making an impact.
To get started, collect two key types of data: Operational Data (like costs, financials, and internal performance metrics) and Experience Data (customer feedback and sentiment). Avoid data silos by consolidating systems like your helpdesk, CRM, and accounting tools. If your financial reports and support metrics are scattered across different platforms, it’ll be tough to connect costs with outcomes. Early integration ensures that Finance, Support, and Product teams are working from the same playbook.
Set a quarterly baseline to account for seasonal trends and business growth. During this period, track these four metric categories:
- Performance: Metrics such as First Contact Resolution and Average Handle Time.
- Satisfaction: Indicators like CSAT, NPS, and Customer Effort Score.
- Financial: Measurements including Cost per Ticket, Support Cost as a Percentage of Revenue, and Customer Lifetime Value.
- Loyalty: Metrics like Churn Rate, Retention Rate, and Contact Rate.
This comprehensive baseline gives you a clear starting point to measure the ROI of future customer experience (CX) improvements. It also helps you identify both obvious and hidden costs.
"Customer experience professionals often struggle to show how their efforts will produce bottom-line results… The key is to effectively prioritize, quantify, and measure your company’s efforts." – Forrester
Don’t overlook hidden costs like agent onboarding, software licensing, and overhead expenses (e.g., utilities and rent). Additionally, define support-driven conversions – like tickets that lead to upgrades or prevent churn – to measure expansion ROI. For the most accurate feedback, send CSAT surveys right after resolving a ticket. By following these steps, you’ll create a solid baseline that allows you to measure future progress with precision.
Key Baseline Metrics to Track
Once you’ve established a baseline, the next step is to focus on the metrics that reveal your ROI. These metrics shed light on how your support operations impact your bottom line.
To get a full picture, monitor four key categories: efficiency, financial, retention, and experience.
Start with efficiency metrics like First Contact Resolution (FCR) and Average Handle Time (AHT). FCR shows how often customer issues are resolved in a single interaction. A higher FCR reduces repeat tickets and cuts operational costs. AHT, on the other hand, measures the time agents spend per interaction. For example, a subscription-based toy retailer boosted ticket resolution by 86% and improved agent productivity by 10–15% by focusing on these metrics.
From a financial perspective, calculate Cost per Ticket by dividing total support costs (including salaries, tools, and overhead) by the number of tickets handled. Another critical metric is Customer Lifetime Value (CLV), which connects service quality to long-term revenue potential.
Retention metrics are equally important. Keep an eye on your Churn Rate and Customer Retention Rate:
- Retention Rate = [(Total Customers at End – New Customers) / Customers at Start] x 100
- Churn Rate = [(Customers at Start – Customers at End) / Customers at Start] x 100
Why does this matter? Increasing customer retention by just 5% can drive profits up by 25% to as much as 95%.
Experience metrics, like Customer Effort Score (CES) and Net Promoter Score (NPS), also play a major role. These scores act as early indicators of customer loyalty and potential revenue.
"Customer service ROI connects what organizations invest in support – the people, technology, and processes – to measurable business outcomes like retained revenue, expansion, and operational savings."
– Anjana Vasan, Principal Content Marketer, Parloa
In B2B support, these metrics take on added importance. Not only do they measure efficiency, but they also highlight opportunities for revenue growth and process improvement. For instance, tracking expansion revenue from support interactions can reveal how customer service drives upselling or cross-selling. Additionally, monitoring escalation rates can help identify gaps in your processes.
Tools and Methods for Collecting Baseline Data
Having the right tools in place can make a huge difference when it comes to gathering accurate baseline data. For starters, your helpdesk or CRM system is a goldmine of information, automatically tracking metrics like agent time, ticket volume, and resolution speeds. These metrics form a solid foundation for calculating key figures like Cost per Ticket and Average Handle Time. To get the most out of this data, pair it with business intelligence tools to create a more complete picture.
For a truly comprehensive view, it’s essential to combine data from multiple sources. Business intelligence dashboards – such as Tableau, Looker Studio, or Power BI – can merge support costs with customer sentiment and revenue metrics like Customer Lifetime Value (CLV). This integration creates a "single source of truth", linking every customer interaction to its financial impact. Without this connection, your data ends up in silos, making it nearly impossible to understand the true ROI of your efforts.
AI-powered quality assurance tools add another layer of precision. These tools analyze every customer conversation in real time, identifying sentiment and intent without the need for manual sampling. For instance, in August 2025, Lush implemented AI-driven feedback analysis and saw a 369% ROI, recovering their investment in under a year. By eliminating sampling bias, these tools ensure that your baseline reflects your entire customer base, not just a small subset.
Historical data analysis is just as important. Reviewing past chat transcripts, call recordings, and emails uncovers patterns that affect customer satisfaction and handle times. To ensure accuracy, use timestamped surveys immediately after ticket resolution. This approach captures feedback tied to specific interactions rather than general impressions.
Lastly, system integration is key to avoiding fragmented data. By connecting your helpdesk, CRM, and financial tools, you can tie every support interaction directly to a customer record and its revenue outcome. This unified approach not only streamlines ROI calculations but also provides leadership with clear, actionable insights.
"Measuring customer service ROI by hand? That’s pointless because the data moves too fast and in too many directions – you’ll always miss something."
– Regina Ongkiko, Freelance Content Writer at LTVplus
Measuring Cost Savings and Efficiency Gains
Once you’ve established your baseline metrics, the next step is to calculate the dollars and hours saved as a result of your customer experience (CX) improvements. These metrics provide a clear picture of the financial and operational benefits your efforts have delivered. A key metric to track is Cost per Contact, which is calculated by dividing your total support costs by the number of customer interactions. For example, if your Cost per Contact drops from $15.00 to $9.00 after introducing AI-driven automation, that’s a 40% reduction in costs.
Another area to focus on is agent efficiency savings. This can be calculated using the formula: (Pre-improvement agent hours per issue – Post-improvement agent hours per issue) × Total issues × Agent hourly rate. For instance, if an agent used to spend 30 minutes on a billing inquiry but now resolves it in just 18 minutes thanks to automation, that 12-minute improvement quickly adds up when scaled across thousands of interactions.
You should also measure your Containment Rate, which reflects the percentage of issues resolved by AI or self-service tools without requiring human intervention. For example, a major e-commerce retailer achieved a 78% containment rate within six months of implementing an AI support platform. This means that 78 out of every 100 tier-1 inquiries were resolved without involving an agent. To calculate containment savings, multiply the number of issues resolved by AI by the average cost of a human-handled interaction. If your average human-handled ticket costs $12.00 and your AI resolves 5,000 tickets per month, that’s a monthly savings of $60,000.
It’s also important to track channel-specific costs to determine where automation delivers the most value. By analyzing costs by channel and product area, you can identify the areas where efficiency improvements have the greatest impact.
One B2B SaaS company serves as a strong example of these benefits. By reducing its support costs as a percentage of revenue from 12% to 7%, the company achieved a 320% ROI over two years with a payback period of just five months. These results were driven by closely monitoring metrics like First Contact Resolution (FCR) and Average Handle Time (AHT), and linking those improvements to labor costs and resource allocation. For instance, reducing AHT by 20–40% enabled the company to handle a 120% increase in order volume without hiring 45 additional agents. This shift transformed their support function from a cost center into a strategic advantage.
Efficiency Metrics That Impact ROI
When it comes to proving the financial benefits of customer experience (CX) improvements, focusing on efficiency metrics is key. These metrics directly influence ROI by cutting operational costs or boosting agent capacity without requiring additional staff.
One of the most impactful metrics is Average Handle Time (AHT). Reducing AHT allows agents to manage more inquiries within the same amount of time, effectively increasing capacity without raising labor costs. AI-driven automation plays a big role here, significantly cutting down AHT by automating repetitive tasks. For instance, if agents currently spend 8 minutes per ticket and AI reduces that to 5 minutes, the 3-minute savings across thousands of interactions can lead to substantial labor cost reductions. When paired with accurate cost tracking, these savings clearly demonstrate how efficiency improvements translate into ROI.
Another critical metric is First Contact Resolution (FCR). Resolving issues on the first interaction avoids the extra costs of follow-up contacts. Each additional interaction adds to operational expenses, so improving FCR helps keep costs in check. Beyond cost savings, FCR has a direct impact on customer satisfaction (CSAT). Studies show that for every 1% improvement in FCR, CSAT typically increases by 1% as well. In B2B settings, where customer retention is crucial, better FCR not only reduces churn risk but also safeguards recurring revenue streams.
Agent Utilization is another lever for refining ROI. This metric measures how effectively agents are being deployed. Ideally, utilization rates should fall between 75% and 85% to strike a balance between productivity and preventing burnout. AI-powered platforms enhance utilization by automating routine Level 1 queries (which can be fully automated) and assisting with about 50% of Level 2 queries. This allows agents to focus on more complex, high-value interactions.
Finally, tracking cost per contact ties these metrics to financial outcomes. Traditional contact center costs range from $2.70 to $5.60 per interaction, but AI solutions can drive this down to as low as $0.40. Since agent compensation accounts for 60% to 70% of total contact costs, improvements in AHT, FCR, and utilization significantly reduce this major expense while maintaining – or even improving – service quality.
Comparing Before and After: Visualizing Cost Savings
After gathering baseline data and tracking efficiency gains, the next step is to present these improvements in a way that resonates with stakeholders. A well-crafted comparison table or dashboard can transform raw numbers into a compelling financial narrative, showcasing how support operations evolve into a measurable revenue contributor.
To ensure accurate comparisons, use a consistent timeframe, such as month-over-month or quarter-over-quarter. This helps isolate the real impact of initiatives like AI automation while accounting for seasonal trends and fluctuations.
Here’s how to structure an effective comparison table:
- Pre-improvement baseline: Captures the starting point before changes were implemented.
- Post-improvement current state: Reflects the metrics after improvements.
- Percentage delta: Highlights the change in percentage terms, making trends easy to spot.
- Financial impact: Converts efficiency gains into dollar amounts by factoring in metrics like saved hours or avoided tasks. For example, multiply saved hours by the fully loaded agent cost (typically $25–$45 per hour in the U.S., including benefits and overhead).
The percentage delta column is particularly impactful. For instance, a 34% reduction in average handle time or a 37% drop in cost per contact clearly demonstrates operational progress. To make this even more tangible, translate these improvements into financial terms. For example, in May 2025, a leading e-commerce retailer achieved a 62% reduction in cost per contact – from $15.00 to $5.70 – while maintaining a 78% containment rate. This avoided the need for 45 additional hires during a 120% surge in order volume, resulting in a 285% ROI over three years.
When creating visualizations, segment by interaction type to pinpoint where automation delivers the most value. Break down interactions into three categories: AI-only, human-only, and AI-assisted. This level of detail reveals which scenarios benefit most from automation and where human involvement remains critical. Tools like Tableau, Looker Studio, or Microsoft Power BI can combine helpdesk and CRM data into a unified dashboard. Such visualizations not only highlight service efficiency but also connect these gains to retention and growth metrics, setting the stage for further analysis in upcoming sections.
Connecting CX Improvements to Revenue and Retention
Beyond streamlining operations, improving customer experience (CX) can directly boost revenue and retention, turning your support team into a growth driver.
CX’s value lies in its ability to enhance retention and drive revenue. While cost savings highlight operational success, metrics like retention and revenue growth show whether your support efforts are contributing to the bottom line.
One way to measure this is by calculating Saved Revenue, which represents the value of retaining at-risk customers. To find this, multiply the number of customers retained by their remaining Lifetime Value (LTV). For instance, if your support team prevents 50 customer churns in a quarter, and each customer has an LTV of $12,000, you’ve effectively saved $600,000. This turns your support team into a revenue safeguard, not just a cost center.
To assess the impact of CX improvements more accurately, consider methods like A/B testing, geographic splits, or pre/post analysis using matched cohorts and seasonality adjustments. Then, track Net Revenue Retention (NRR), which captures both churn prevention and revenue expansion. These approaches provide a more comprehensive view of CX’s return on investment.
"The ROI isn’t in the ticket you closed, but in the customer who came back." – Mathew Patterson, Help Scout
You can also link customer satisfaction directly to financial outcomes. By mapping metrics like CSAT or NPS to renewal rates in your CRM, you’ll likely find that customers who report positive support experiences are more inclined to renew and expand their contracts. The key is connecting these satisfaction scores to actual purchasing behavior, making the financial impact of CX improvements unmistakable.
Tracking Retention and Lifetime Value Changes
To measure the impact of customer experience (CX) improvements, start by tracking Customer Retention Rate (CRR) and Churn Rate. CRR is calculated as:
[(End Customers – New Customers) ÷ Start Customers] × 100.
Churn Rate, its inverse, is:
[(Customers Lost ÷ Customers at Start) × 100].
Retention improvements directly influence Customer Lifetime Value (CLV), which is determined by multiplying Average Revenue per Customer by the Average Retention Period. Lowering churn ensures you retain the full lifetime value of each customer. For instance, a B2B SaaS company increased customer retention by 12%, leading to a 320% ROI over two years, with a payback period of just five months. These insights pave the way for deeper analysis, such as cohort comparisons and revenue assessments.
Using your baseline data, apply cohort analysis to compare groups of customers who experienced the updated support approach with those who didn’t. When random testing isn’t feasible, matched cohorts with seasonality adjustments help account for external influences. This method ensures retention gains are linked to your CX initiatives, not external market factors.
For B2B support, the standout metric is Net Revenue Retention (NRR), calculated as:
[(Starting Revenue + Expansion – Churn) ÷ Starting Revenue].
NRR goes beyond simple retention rates by capturing both churn reduction and revenue growth from upsells and expansions. Effective support not only prevents churn but also drives contract expansions, turning support from a cost center into a revenue generator.
sbb-itb-e60d259
Linking Satisfaction Scores to Revenue Impact
When it comes to validating your CX investments, connecting satisfaction scores to revenue impact is a game-changer. While earlier sections focused on efficiency and retention, this approach takes it a step further by tying customer feedback directly to financial outcomes.
Metrics like Net Promoter Score (NPS) and Customer Effort Score (CES) do more than just measure customer sentiment – they help forecast revenue shifts. To calculate this impact, align these scores with behavioral data in your CRM, such as renewal rates, churn, and expansion revenue. A practical example? Compare the Lifetime Value (LTV) of a "Promoter" (NPS 9-10) to that of a "Detractor" (NPS 0-6). The difference in LTV highlights the revenue potential of turning a detractor into a promoter.
Customer Effort Score, in particular, is a strong predictor of loyalty. Lower effort scores consistently correlate with higher retention and reduced churn. To maximize its impact, send CES surveys immediately after issue resolution. This timing ensures you capture the real-time effects of specific interactions on customer loyalty and renewal rates.
Another key strategy? Track dissatisfied customers (low NPS or high CES) who were retained through targeted support efforts. Use a "Saved Revenue" formula – Number of Saves × Remaining LTV – to measure the financial benefit of these retention efforts. For instance, proactive recovery strategies can deliver significant annual savings by reducing churn.
To quantify the overall retention impact, apply this formula:
(Post-Improvement Retention Rate – Pre-Improvement Retention Rate) × Total Customers × Average LTV.
"There’s just one CX metric that matters to your C-Suite… It’s $." – Forrester
The takeaway? Satisfaction scores only matter when you can tie them to dollars. By integrating NPS and CES data with customer behavior in your CRM, segmenting by satisfaction levels, and calculating the revenue differences between satisfied and dissatisfied customers, you directly link customer sentiment to financial performance.
Up next: how AI can sharpen these measurements for even deeper insights.
Using AI to Measure CX ROI in B2B Support
When it comes to measuring Customer Experience (CX) ROI in B2B support, AI introduces a game-changing approach by analyzing every single interaction. Instead of relying on traditional sample-based reviews, AI evaluates all customer touchpoints – tickets, chats, emails – instantly. It scores, categorizes, and provides actionable insights in real time, ensuring no interaction goes unnoticed.
One of AI’s standout capabilities is its ability to deliver immediate insights into customer sentiment. Unlike sporadic surveys with low response rates, AI continuously assesses customer emotions and intent during interactions. This real-time sentiment analysis becomes a powerful tool for identifying early signs of churn risk or uncovering potential expansion opportunities. For teams managing intricate, long-term customer relationships, these insights are invaluable.
AI also excels at identifying and measuring efficiency gains, even on a smaller scale. Take manual ticket categorization and routing, for example – tasks that typically consume 2–3 minutes per ticket. Multiply that across thousands of interactions, and you’re looking at significant time savings. With AI-driven automation, these processes are streamlined, saving hundreds of agent hours. Beyond that, AI reduces interruptions for subject matter experts (SMEs) by minimizing internal escalations and Slack messages. In fact, one study found that AI-powered internal knowledge searches cut down average information wait times from 33 minutes to nearly instantaneous responses. These efficiency gains not only improve day-to-day operations but also establish a direct connection between operational metrics and financial performance.
The real leap forward comes when these operational improvements are tied to financial outcomes. AI platforms can sync with CRM and financial systems, linking metrics like First Contact Resolution (FCR) and Average Handle Time (AHT) to key financial indicators such as Net Revenue Retention (NRR) and Customer Lifetime Value (LTV). For example, in 2025, cybersecurity firm Cynet adopted an AI-powered support solution that delivered impressive results: a 47% ticket deflection rate, a 14-point increase in CSAT, and nearly half of all tickets resolved at Tier 1. This reduced the workload for senior engineers and demonstrated the financial impact of AI-driven support.
Up next, we’ll look at how to create automated dashboards that harness these AI insights to drive smarter decision-making.
AI-Powered Predictive Metrics
As customer experience (CX) efforts continue to grow, predictive metrics offer a forward-thinking way to build on existing data and improve efficiency. Traditional surveys often fall short – they capture limited feedback and usually arrive too late to make a difference. Predictive CSAT changes the game by evaluating customer sentiment and satisfaction in real time, even before surveys are sent. Using AI to analyze tone, language patterns, and resolution quality, it identifies dissatisfaction the moment it arises. This means you can act on at-risk accounts immediately, rather than waiting days or weeks for feedback after a post-interaction survey. This instant insight allows for proactive interventions at every stage of the support process.
Predictive Customer Effort Score (CES) takes this a step further by measuring how difficult an interaction is, based on factors like complexity and resolution time. High-effort exchanges are flagged in real time, giving teams the chance to step in right away – whether that’s escalating to a senior agent or addressing friction points before they escalate into bigger problems.
Another long-standing challenge in support – accurately measuring First Contact Resolution (FCR) – is now tackled by AI. Traditionally, determining whether an issue was resolved on the first try required manual review. AI automates this by analyzing conversation transcripts and tracking customer behavior to confirm whether the problem was truly resolved or just marked as closed. This eliminates guesswork, providing a precise efficiency metric tied directly to cost savings.
Beyond improving visibility, predictive metrics play a critical role in protecting revenue. In B2B settings, where a single customer may represent a large chunk of Annual Recurring Revenue (ARR), AI can highlight accounts at risk due to delays, unresolved issues, or repeated high-effort interactions. By linking these signals to CRM data, support teams can quantify the financial impact of proactive measures, showing how they prevented churn or safeguarded growth opportunities.
Unlike traditional quality assurance (QA) programs that review only 2–5% of interactions, AI-powered predictive metrics deliver full coverage with unmatched accuracy and forward-looking insights. By scaling these tools, support teams can connect every customer interaction to operational and financial outcomes, demonstrating measurable business value while continuing to refine processes for even greater impact.
Building Automated ROI Dashboards with AI
AI’s ability to measure every interaction opens the door to automated ROI dashboards that turn raw data into actionable financial insights. Many teams face a common challenge: proving the value of AI. While 96% of businesses believe generative AI enhances customer interactions, only 29% of CX leaders actively track ROI. Traditional reporting methods, which rely on manual data collection and coordination across departments, often result in outdated metrics by the time reports are finalized.
AI-powered dashboards solve this problem by linking operational performance to financial outcomes in real time. These systems pull data from tools like your helpdesk, CRM, and financial platforms, creating a unified dashboard that updates continuously. They track both efficiency metrics (like AHT and FCR) and revenue indicators (such as NRR and expansion revenue), automatically calculating their financial impact. By connecting these metrics directly to financial results, these dashboards strengthen the ROI measurement framework and provide comprehensive visibility across all customer interactions.
The standout feature? 100% interaction coverage. AI analyzes every customer conversation for quality, sentiment, and compliance. This data feeds directly into executive dashboards, linking ticket volumes to deeper insights like customer health, churn risk, and lifetime value.
Before implementing these dashboards, it’s crucial to establish baseline metrics. Record your current cost per ticket, AHT, and agent utilization so the AI can calculate "before and after" differences. Then, integrate data from your helpdesk, CRM, survey tools, and financial systems to map service interactions to measurable outcomes like renewals and upsells. This process also reveals "micro-efficiencies" often overlooked in manual reporting, such as time saved on ticket routing or standardized responses, which contribute to overall productivity gains.
When reporting to executives, focus on financial metrics rather than operational details. CFOs are more interested in metrics like CAC payback, expansion revenue, and cost-to-serve. AI dashboards can even translate qualitative improvements into quantifiable value. For example, a 7-point increase in CSAT might reduce churn by 1%, and when multiplied by the remaining lifetime value of affected customers, the savings become a tangible dollar amount.
"Measuring customer service ROI isn’t just about numbers on a dashboard: it’s about proving how support drives real business value." – Chris Kontes, Co-Founder of Balto
These dashboards empower teams to present ROI to executive leadership with clarity and confidence, demonstrating the direct connection between customer service and business outcomes.
How to Calculate and Present ROI
To calculate ROI effectively, you need a clear framework that ties performance improvements directly to financial outcomes. The formula is straightforward: [(Value Generated – Cost of Investment) ÷ Cost of Investment] x 100. The challenge lies in defining "value" in a way that connects customer support performance to measurable financial results.
Breaking Down the Components
Value Generated includes three main factors:
- Revenue Growth: Gains from expansion and upsells influenced by support.
- Saved Revenue: Reduced churn rates that retain existing customers.
- Operational Savings: Efficiencies like shorter average handle times (AHT) and fewer incoming tickets.
For B2B companies, focusing on Net Revenue Retention (NRR) is particularly impactful. NRR combines customer retention and expansion into one metric, making it easier to communicate value to financial stakeholders like CFOs.
Cost of Investment encompasses both upfront and ongoing expenses:
- Initial Costs: Software licenses, implementation, integration, and training.
- Recurring Costs: Subscriptions, maintenance, and AI tuning fees.
When presenting ROI, it’s essential to include the full scope of these costs and clearly outline the expected payback period. For instance, an e-commerce retailer that implemented an AI-driven support platform saw a 62% reduction in cost per contact within six months, achieving a 285% ROI over three years with a seven-month payback period. This type of detailed cost-benefit analysis strengthens your case.
Tailoring ROI Presentations to Your Audience
When sharing ROI insights, tailor your focus based on the audience:
- For Finance Teams: Highlight margin improvements and customer acquisition cost (CAC) payback.
- For Product Teams: Emphasize user adoption rates and feedback on new features.
Using control groups or A/B testing can help isolate the specific impact of your CX initiatives, adding credibility to your financial narrative.
"Telling a compelling financial story is highly achievable, as good CX is good for the top and bottom line. The key is to effectively prioritise, quantify, and measure your company’s efforts." – Forrester
The ROI Calculation Formula
The ROI formula helps connect CX (Customer Experience) improvements directly to financial outcomes, making it easier for CFOs and executives to understand the value. The formula is straightforward: ROI % = ((Total Benefits – Total Costs) / Total Costs) x 100. Let’s break this down into actionable steps tailored for B2B support operations.
Start by calculating your Net Gain: (Revenue Gains + Cost Savings) – CX Investment Costs. Revenue Gains could include expansion revenue from upsells, retained revenue from reducing churn, and a boost in Customer Lifetime Value (CLV). Cost Savings, on the other hand, might come from reduced cost-per-contact, improved agent efficiency, and higher self-service deflection rates.
Next, make sure you account for CX Investment Costs thoroughly. These should cover everything from software licensing, setup, and implementation services to employee training, ongoing maintenance, API usage fees, continuous AI tuning, and integration development.
For B2B operations, it’s also crucial to factor in the Payback Period. This is calculated as Initial Investment ÷ Annual Net Benefits. Executives are particularly interested in knowing how soon the investment will pay off. For example, a B2B SaaS company using conversational AI achieved a 320% ROI over two years with a payback period of just five months. These calculations provide a clear framework to showcase the financial impact of CX improvements.
"ROI translates service performance into the language leadership understands: revenue, margin, and efficiency." – Anjana Vasan, Principal Content Marketer, Parloa
Presenting ROI to Executive Leadership
To gain executive approval, it’s crucial to speak in terms of revenue. Financial leaders care about metrics like NRR (Net Revenue Retention), churn reduction, and cost-per-contact savings. When presenting, use an integrated revenue scorecard that unifies product, marketing, sales, and service teams around shared financial goals. This method ties earlier discussions on baseline metrics directly to the financial outcomes executives prioritize.
Start by translating baseline metrics and efficiency improvements into clear financial results. Use a combination of baseline data, improvement percentages, and their dollar impact. Highlight the payback period – how long it will take to recover the initial investment. For instance, consider an e-commerce retailer that adopted an AI support platform in May 2025. Within six months, they achieved a 62% reduction in cost per contact, a three-year ROI of 285%, and a seven-month payback period. This allowed them to handle 120% growth in order volume without hiring 45 additional agents.
Incorporate a CX ROI Matrix to connect revenue growth, saved revenue, and cost-to-serve reductions to specific financial outcomes. This matrix works alongside automated dashboards, translating performance metrics into financial terms that resonate with leadership.
"Quantifying the ROI of Customer Experience is the missing piece of the value puzzle, bridging the gap between customer insights and financial success." – KPMG
To further validate results, use holdout groups to measure the direct impact of CX initiatives. Start small with experiments like investing $50,000 to reduce response time by 30%, which could result in $200,000 in saved revenue. These smaller wins help demonstrate measurable ROI, building trust and encouraging executives to greenlight larger-scale projects.
Conclusion
Measuring customer experience (CX) ROI requires looking beyond CSAT scores. While satisfaction scores reveal how customers feel, they don’t address what executives care about most: financial impact. As Forrester puts it, "There’s just one CX metric that matters to your C-suite – but you’re not reporting it. It’s , they don’t address what executives care about most: financial impact. As Forrester puts it, "There’s just one CX metric that matters to your C-suite – but you’re not reporting it. It’s $" [18].quot;.
To shift from being seen as a cost center to a profit driver, it’s crucial to track metrics that tie directly to financial results. Metrics like Net Revenue Retention (NRR) and Customer Lifetime Value (CLV) illustrate support’s tangible impact on the bottom line. By pairing these metrics with AI-driven tools that analyze 100% of customer interactions in real time, businesses gain insights far beyond what traditional surveys can offer. Consider this: increasing customer retention by just 5% can lead to profit growth of 25% to as much as 95%.
AI-powered platforms also unlock operational efficiency at scale. Automating Tier 1 support and cutting Average Handle Time (AHT) by 20–40% allows teams to grow without adding headcount proportionally. The focus shifts from periodic, reactive surveys to continuous, predictive measurement – capturing sentiment, intent, and financial outcomes across every customer interaction. This approach aligns with the article’s emphasis on linking CX efforts directly to revenue.
Start by establishing baseline metrics, then leverage AI to demonstrate ROI clearly. Use holdout groups and small experiments to validate results, and create automated dashboards that translate support performance into revenue terms. When you can present a clear payback period, highlight revenue saved, and show operational cost reductions, support evolves from being an expense to becoming a strategic growth engine. This transformation encapsulates the core message of moving from merely tracking sentiment to driving measurable financial outcomes.
FAQs
How can AI help measure the ROI of customer experience improvements beyond CSAT?
AI helps businesses better measure the return on investment (ROI) of customer experience (CX) by offering deeper insights into how customers interact and how operations perform. It allows companies to track key metrics like first-contact resolution, average handle time, and self-service adoption – all of which have a direct impact on customer satisfaction, loyalty, and cost management.
On top of that, AI can assess indirect benefits such as cost reductions through automation, support deflection, and long-term indicators like customer lifetime value (CLV) and revenue growth. Advanced AI tools also link CX improvements to financial outcomes using methods like cohort analysis, A/B testing, and predictive analytics, creating a direct connection between CX efforts and measurable business results.
With AI, businesses can go beyond traditional satisfaction metrics, tapping into actionable, data-backed insights that clearly show how CX investments contribute to their overall financial success.
What are the most important metrics to connect CX improvements to business results?
To link customer experience (CX) improvements to measurable business outcomes, it’s essential to focus on metrics that have a direct impact on revenue and profitability. Key areas to monitor include customer retention, customer lifetime value (CLV), revenue growth, operational efficiency, cost savings, and churn rate.
You should also keep an eye on customer advocacy behaviors, such as referrals and upsell opportunities. These can offer valuable insights into the long-term financial benefits of your CX efforts.
By zeroing in on these metrics, you can clearly show how CX initiatives contribute to meaningful business results and inform smarter strategic decisions.
How can I set a baseline to measure the ROI of CX improvements?
To measure the return on investment (ROI) for improving customer experience (CX), you’ll need to start by documenting your current metrics. Key areas to track include customer retention rates, average response times, and operational costs. These figures will act as your baseline.
Next, pinpoint the areas where you anticipate making improvements. For example, will better CX lead to higher revenue or lower expenses? Assign estimated dollar values to these potential changes to help quantify their impact.
Once you’ve implemented your CX initiatives, use structured tools or models to compare your performance data before and after the changes. This approach allows you to clearly track progress and showcase the financial benefits of your efforts. Be sure to focus on metrics that directly support your business goals – this will make your analysis more relevant and actionable.