
Tracking too many metrics is hurting your customer support. Most support teams drown in data but fail to focus on what truly matters: effectiveness. Instead of monitoring dozens of metrics, narrowing your focus to 5–7 key performance indicators (KPIs) can transform your support operations. These KPIs directly impact customer retention, operational costs, and satisfaction.
Here are the 5 KPIs that matter most for B2B support:
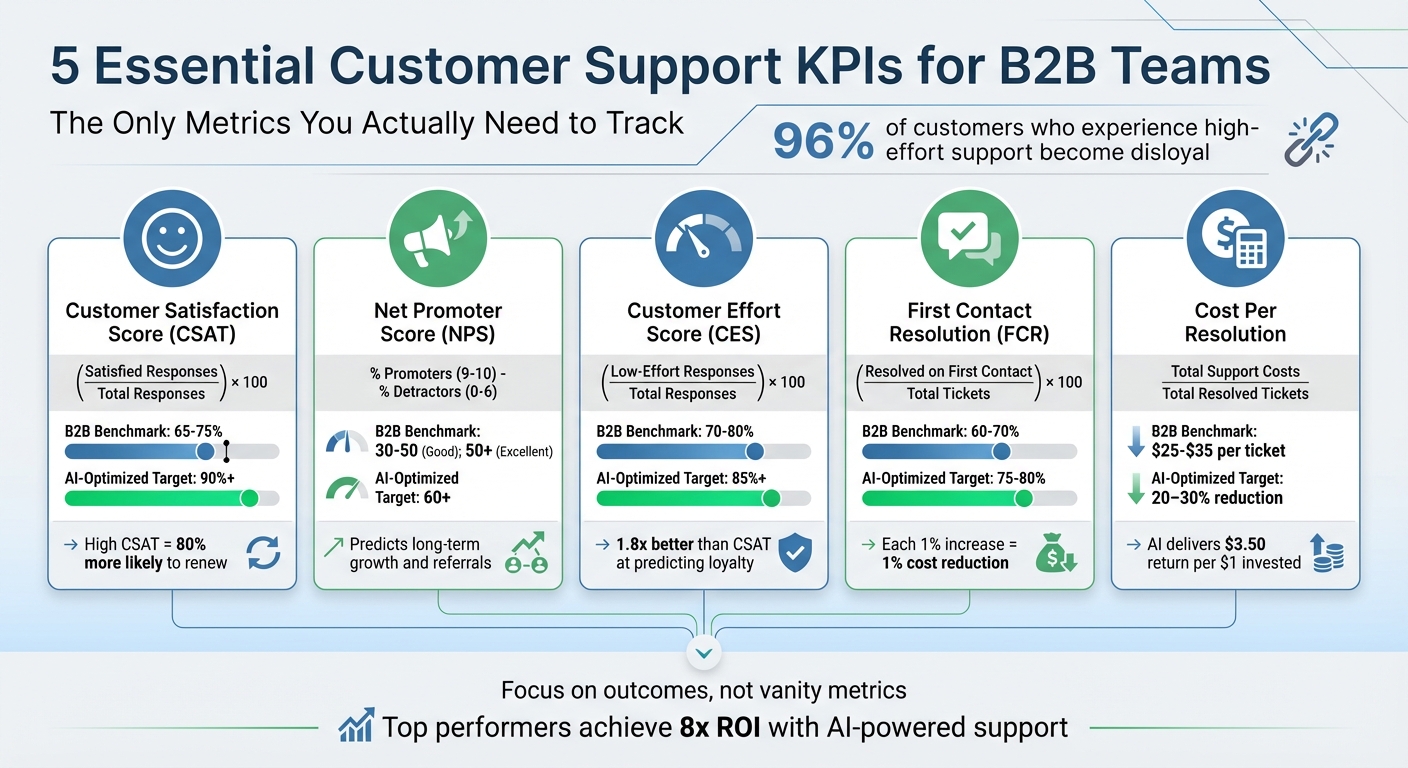
- Customer Satisfaction Score (CSAT): Measures how satisfied customers are after support interactions. High CSAT predicts loyalty.
- Net Promoter Score (NPS): Evaluates overall customer relationships and likelihood of referrals.
- Customer Effort Score (CES): Tracks how easy it is for customers to get their issues resolved. Low effort = higher loyalty.
- First Contact Resolution (FCR): Measures if issues are resolved on the first attempt, reducing follow-ups and costs.
- Cost Per Resolution: Calculates the cost of resolving a single ticket, helping manage resources effectively.
Key takeaway: Focus on these KPIs to improve satisfaction, reduce churn, and lower costs. AI tools can help by providing real-time insights, automating processes, and consolidating data into unified dashboards.
96% of customers who experience high-effort support become disloyal. Tracking the right metrics isn’t just helpful – it’s necessary for keeping your customers happy and your business thriving.
5 Essential Customer Support KPIs: Formulas, Benchmarks & Impact
The Honest Customer Support KPIs
The 5 KPIs That Actually Matter for B2B Support
Tracking the right KPIs can cut through the overwhelming amount of data and focus your efforts on what truly drives results. These five KPIs directly impact customer retention, operational efficiency, and cost management – ultimately determining whether your support team is a profit generator or an expense. Here’s a closer look at each KPI, what it measures, and how it can influence your support strategy.
Customer Satisfaction Score (CSAT)
CSAT is a straightforward way to measure how satisfied customers are after interacting with your support team. Customers typically rate their experience on a scale from 1 to 5, and the score is calculated as:
Formula: (Satisfied Responses / Total Responses) × 100
For B2B SaaS companies, the average CSAT hovers around 68%. High scores are a strong predictor of loyalty – customers who rate their experiences positively are 80% more likely to renew, while those giving low scores are 90% more likely to churn. It’s no wonder that 88% of organizations rely on CSAT as a key metric for their service teams. Modern AI tools can even analyze sentiment directly from ticket text, reducing the need for traditional surveys.
Net Promoter Score (NPS)
Unlike CSAT, which focuses on individual interactions, NPS measures the overall strength of your customer relationships. The question is simple: "How likely are you to recommend our product to a colleague?" Responses are divided into Promoters (9–10), Passives (7–8), and Detractors (0–6). The formula is:
Formula: % Promoters – % Detractors
In B2B industries, the average NPS is around 48, with scores above 50 indicating strong performance. For the Technology/SaaS sector, the average is slightly lower at 45, but top-performing companies can exceed 60. AI can help you dig deeper into NPS data, pinpointing the behaviors that drive advocacy among Promoters and identifying issues causing churn among Detractors.
Customer Effort Score (CES)
CES evaluates how easy it is for customers to resolve their issues, asking, "How easy was it to get your issue resolved?" It’s calculated as:
Formula: (Low-Effort Responses / Total Responses) × 100
Research shows CES is 1.8 times better than CSAT at predicting customer loyalty. High-effort interactions are a major red flag – 96% of customers who struggle to resolve their issues become disloyal, compared to just 9% of those who find the process seamless. The typical B2B benchmark for CES ranges from 70% to 80%. Strategies like "next issue avoidance", where agents anticipate follow-up questions, and AI tools like session replay can help reduce effort by showing agents exactly what the customer sees.
First Contact Resolution (FCR)
FCR measures how often issues are resolved during the first interaction, without requiring follow-ups or escalations. It’s calculated as:
Formula: (Resolved on First Contact / Total Tickets) × 100
Improving FCR has a direct impact on both costs and satisfaction. Each 1% increase in FCR reduces operating costs by 1% and can push satisfaction rates above 90%. Companies with high FCR also see churn rates drop by up to 67%. In complex B2B environments, FCR rates typically fall between 60% and 70%. To improve this metric, collect detailed technical information upfront using intake forms and equip agents with AI tools that suggest solutions in real time.
Cost Per Resolution
This KPI measures the financial investment required to resolve a single ticket, including labor, tools, and overhead. The formula is:
Formula: Total Support Costs / Total Resolved Tickets
For B2B support teams, the average cost per resolution ranges from $25 to $35 per ticket. Many companies underestimate this cost by excluding factors like after-call work and software subscriptions. Routine tasks like password resets or status updates can drain resources, but AI deflection strategies can help. Teams using AI-powered support report a $3.50 return for every $1 invested, with top performers achieving up to an 8x ROI. Automating repetitive tasks frees up human agents to focus on complex troubleshooting, maximizing both efficiency and value.
| Metric | Formula | B2B Benchmark |
|---|---|---|
| CSAT | (Satisfied Responses / Total Responses) × 100 | 65–75% |
| NPS | % Promoters (9–10) – % Detractors (0–6) | 30–50 (Good); 50+ (Excellent) |
| CES | (Low-Effort Responses / Total Responses) × 100 | 70–80% |
| FCR | (Resolved on First Contact / Total Tickets) × 100 | 60–70% (Complex B2B) |
| Cost Per Resolution | Total Support Costs / Total Resolved Tickets | $25–$35 (Technology) |
How AI Helps You Track and Improve These KPIs
AI takes KPI tracking to the next level by turning data into real-time, actionable insights. Instead of waiting for poor CSAT scores or customer complaints to highlight issues, AI-powered platforms can predict and address risks – like SLA breaches or sudden spikes in escalations – before they even occur. This shift toward proactive problem-solving enables predictive insights that can fine-tune every aspect of customer support.
"The best metrics don’t just track history – they change what happens next." – Eric Klimuk, Founder and CTO, Supportbench
AI-Powered Predictive Metrics
AI tools are designed to cut through the clutter and focus on what truly matters. Predictive analytics dive deep into ticket data and customer histories to forecast which interactions might lead to low CSAT or high CES scores. This allows managers to step in and resolve issues while the case is still open. For instance, AI can identify "rage prompting" – patterns like negative sentiment, excessive use of all caps, or profanity – and flag frustration loops where customers repeatedly ask the same question. Additionally, predictive models can anticipate ticket spikes tied to product launches or seasonal trends, helping teams adjust staffing to prevent backlogs and maintain smooth operations.
Automated Case Management and Resolution
AI streamlines case management by automating tasks like ticket triage, routing, and resolution. Sentiment analysis and urgency detection ensure that high-priority tickets are routed to the right agents immediately. Routine tasks, such as tagging and categorization, are handled automatically, allowing agents to focus on resolving issues.
Real-time AI suggestions further enhance efficiency by analyzing ticket content and surfacing relevant knowledge base articles, improving first-contact resolution rates. Features like session replay enable agents to see exactly what the customer is experiencing, cutting down on back-and-forth explanations. For simpler requests – like password resets or order status updates – AI-driven chatbots can handle the entire process, freeing up human agents to tackle more complex challenges.
Unified Dashboards for Complete Visibility
AI doesn’t just automate processes – it also consolidates data from all support channels into a single, easy-to-read dashboard. By unifying email, chat, voice, and self-service data, AI platforms provide a comprehensive view of performance, eliminating blind spots caused by fragmented systems. This centralized approach makes it easier to identify and address performance gaps.
"An effective support metrics dashboard should function like a flight deck, identifying risks early, guiding team prioritization, and adjusting performance as needed during operations." – Supportbench
Modern dashboards go beyond static metrics. They provide automated analytics to track trends like backlog growth, friction points, and escalation patterns, offering insights into the "why" behind the numbers. Real-time alerts notify teams when metrics start to decline, enabling quick corrective actions. Customizable dashboards can also align metrics with specific business goals, such as reducing churn or cutting costs per ticket. With 69% of support leaders planning to increase their AI investments in the coming year, these unified dashboards are quickly becoming essential for teams striving to maximize efficiency. By centralizing data and offering actionable insights, AI-powered dashboards not only enhance clarity but also drive meaningful improvements.
sbb-itb-e60d259
Benchmarks and How to Improve Your Metrics
Industry Benchmarks vs. AI-Optimized Targets
Comparing your team’s performance against industry standards can highlight areas for growth. Here’s how standard benchmarks stack up against AI-optimized targets:
| Metric | Standard B2B Benchmark | AI-Optimized Target | Operational Impact |
|---|---|---|---|
| CSAT | 75% – 85% | 90%+ | Higher satisfaction boosts renewal rates by 80% |
| NPS | 30 – 50 | 60+ | Indicates long-term growth and organic referrals |
| FCR | 60% – 70% (Complex B2B) | 75% – 80% | Each 1% gain in FCR reduces costs by 1% |
| FRT (Email) | 12 – 24 Hours | < 4 Hours | Faster responses improve satisfaction by 30% |
| FRT (Chat) | < 5 Minutes | < 2 Minutes | 90% of customers expect replies within 10 minutes |
| Cost Per Resolution | $25 – $35 (Technology) | 20% – 30% reduction | Transforms support from a cost center to a value driver |
Leveraging AI-driven insights can help close the gap between standard benchmarks and these optimized targets. For instance, in 2025, Kiwi.com, an online travel agency, handled over 1,500 partner emails monthly. By adopting an omnichannel inbox with automated assignment, they achieved 100% compliance with their 24-hour SLA, eliminating missed messages and accountability issues.
"Average is not good enough. You’ve got to avoid mediocrity and create moments of magic – experiences just a little better than expected."
- Shep Hyken, Chief Amazement Officer, Shepard Presentations
While these AI-optimized targets are inspiring, tracking metrics incorrectly can derail progress.
Common Mistakes in KPI Tracking and How to Avoid Them
Even with clear benchmarks, poor KPI tracking can undermine your efforts. For example, overemphasizing speed – like pushing Average Handle Time (AHT) too low – often sacrifices first-contact resolution, leading to higher costs. A quick response is only valuable if it resolves the issue.
Another common issue is focusing on vanity metrics, such as ticket volume, without considering resolution quality. High ticket numbers might seem impressive, but if issues aren’t resolved effectively, they signal inefficiency rather than success.
Incentivizing speed over quality can also backfire. When agents are rewarded solely for closing tickets quickly, they might cherry-pick easy cases or close tickets prematurely, resulting in higher reopen rates and frustrated customers. Instead, prioritize metrics like Customer Effort Score (CES), which is 1.8 times more effective than CSAT at predicting customer loyalty.
Static reports are another pitfall. Weekly PDFs don’t allow teams to act quickly on emerging issues. Switching to live dashboards that flag SLA breaches or escalating problems can help your team address concerns before they escalate. Additionally, segment benchmarks by issue complexity. For example, set different resolution time goals: under 2 hours for simple cases, under 12 hours for moderate ones, and under 48 hours for complex problems. This approach ensures realistic goals while fostering ongoing improvements.
Conclusion
Key Takeaways for B2B Support Leaders
Tracking the right metrics transforms support from a cost-heavy necessity into a key driver of customer loyalty and revenue growth. The five KPIs highlighted here – CSAT, NPS, CES, FCR, and Cost Per Resolution – give leaders the clarity they need to make impactful decisions. And the numbers speak volumes: organizations leveraging AI-powered support solutions see a $3.50 return for every $1 invested, with top-performing companies achieving an impressive 8x ROI.
Here’s something to think about: 96% of customers who encounter high-effort interactions end up disloyal. This makes operational clarity not just important but essential. The focus should be on outcomes that matter – customer satisfaction, efficiency, and retention – not vanity metrics like the sheer number of tickets closed. For example, improving First Contact Resolution (FCR) by just 1% can reduce costs by the same percentage while also boosting satisfaction. And when acquiring new customers costs five times more than keeping your current ones, these efficiency gains directly protect your bottom line.
AI-native platforms take these insights a step further by simplifying and enhancing support operations. Tools like Supportbench turn raw data into actionable intelligence with features like automated ticket analytics, sentiment detection, and predictive scoring for CSAT and CES – all included for just $32 per agent per month. By offering an all-in-one solution, this approach eliminates the hassle and expense of juggling add-ons and fragmented systems.
FAQs
How do AI tools help improve key customer support metrics?
AI tools significantly improve customer support metrics by taking over repetitive tasks, freeing up agents to handle more challenging and nuanced problems. This shift results in quicker response and resolution times, driving better overall efficiency.
On top of that, AI-powered insights enable agents to solve problems more effectively during the first interaction, which boosts first contact resolution rates and minimizes customer frustration. With predictive analytics, support teams can even offer proactive assistance, spotting potential issues early and addressing them before they grow into bigger problems. This not only keeps customers happy but also strengthens their loyalty.
By fine-tuning these key metrics, AI tools don’t just elevate the customer experience – they also cut down on operational costs, making support teams leaner and more scalable.
Why is it better to focus on fewer customer support metrics?
Focusing on a select few, high-impact customer support metrics lets you zero in on what truly makes a difference – like boosting customer satisfaction and cutting down resolution times. By filtering out unnecessary data, you can make faster, smarter decisions and keep a sharper eye on your progress.
This streamlined approach not only simplifies your workflows but also prevents the overwhelm of overanalyzing. It keeps your team aligned with clear, actionable goals and ensures resources are directed toward meaningful improvements that matter most.
What is First Contact Resolution, and how does it affect costs and customer satisfaction?
First Contact Resolution (FCR) is all about solving a customer’s problem during their very first interaction with your support team – no follow-ups required. A strong FCR rate can help cut down operational costs by reducing repeated inquiries and allowing your team to focus on other priorities.
But FCR isn’t just about saving money; it’s a game-changer for customer satisfaction. When customers get their issues resolved quickly and effectively, they’re more likely to trust your brand and stick around. By monitoring and improving FCR, your team can provide fast, reliable support that keeps customers happy while staying efficient and cost-effective.