Digital customer engagement isn’t just about being present online — it’s about knowing how customers actually interact with your brand across web, app, email, and social channels. Measuring those interactions reveals what creates value, where friction occurs, and how engagement translates into loyalty, retention, and revenue.
This guide explains what digital customer engagement is, why measurement matters, and which metrics give the clearest picture of success. You’ll also learn about the tools that track engagement, from analytics platforms to CRM systems, and how to connect these insights directly to customer satisfaction and ROI.
What is digital customer engagement?

Digital customer engagement is the ongoing, two-way interaction between a customer and a brand on digital channels. It includes page views and taps, but also replies, reviews, content consumption, conversations with support, and repeat use.
Strong engagement looks like purposeful visits, deeper sessions, and completed tasks; weak engagement shows up as short visits, dead ends, and silent churn.
Why Measurement Matters
Measuring engagement allows teams to improve customer experience, raise retention, and spend money where it actually returns value. Done well, measurement shifts the focus from one-off campaigns to lasting relationships.
How can businesses measure digital engagement trends?
Here are practical ways businesses can measure digital engagement trends and connect data to outcomes.
Set clear outcomes by journey stage
Set clear outcomes for each stage of the customer journey: awareness, evaluation, purchase, onboarding, usage, and renewal. For example, in purchase, the primary outcome may be completed checkout; in onboarding, it could be the first key action (e.g., project created). Each stage should be tracked with its specific, measurable goal.
Instrument events and conversions
Track events consistently across web and app. Map event names where possible, and ensure that conversions are accurately marked at the right stage. This consistency ensures that engagement metrics align with actual business goals.
Review trends on a fixed cadence
Analyze engagement data weekly for fast signals and monthly for longer trends. Always break data down by device, traffic source, country/region, and new vs. returning users. Averages can mask issues, so segmenting data reveals the real insights.
Connect activity to revenue
Attribute revenue to channels and campaigns, then monitor lifetime value (LTV) by first touch and last touch. Compare LTV to customer acquisition cost (CAC) to assess whether your growth strategies deliver value over time.
Key Indicators to Measure Digital Engagement
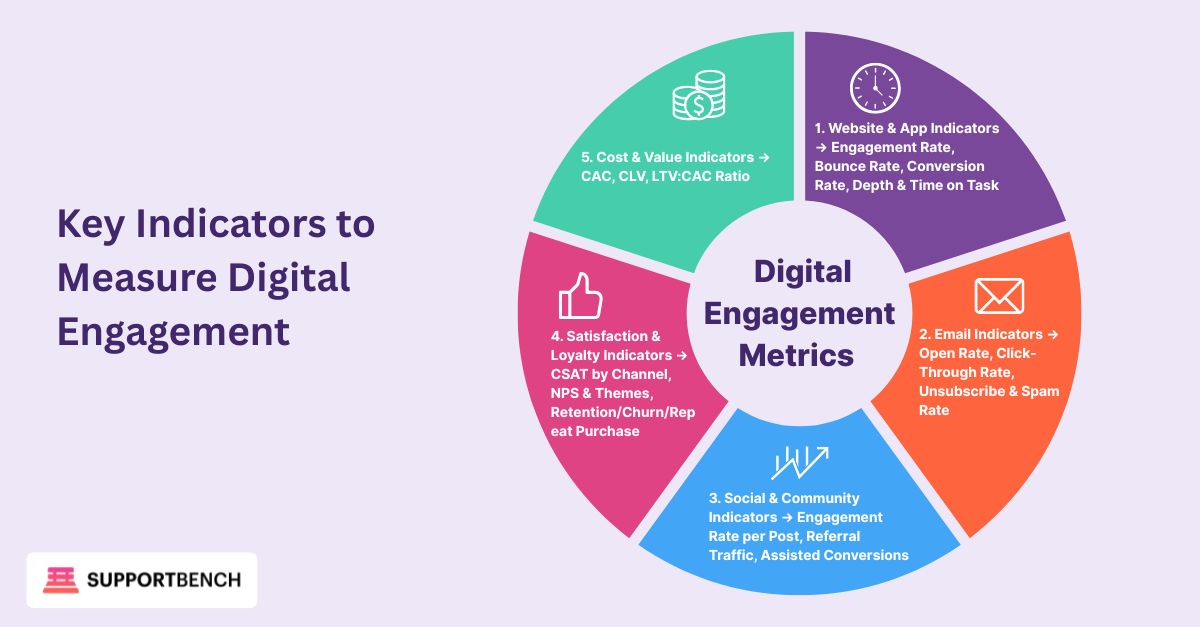
Here are the core metrics businesses should track to understand customer behaviour and performance.
Website and App Indicators
Metrics that show how visitors interact with your site and digital products.
Engagement Rate
Engagement rate measures the share of sessions that are meaningful, such as lasting over 10 seconds, including multiple page views, or recording a conversion. 1
High engagement rates reflect that customers are finding value, which strengthens trust and raises the likelihood of return visits and purchases.
Example: Atlassian tracks feature adoption inside Jira to see which workflows teams actually use, then streamlines onboarding paths to drive higher engagement.
Bounce Rate
Bounce rate is the opposite of engagement rate and indicates sessions that were not meaningful. Monitoring bounce trends can reveal whether traffic quality or content relevance needs adjustment.
Lower bounce rates mean customers are connecting with your content — a foundation for loyalty and long-term retention.
Example: A B2B SaaS provider reduced bounce rates on its pricing pages by adding interactive ROI calculators, helping prospects engage longer and move closer to purchase.
Conversion Rate
Conversion rate is the percentage of visitors who complete a desired action, such as a purchase, demo request, or trial start. Tracking smaller actions, like add-to-cart clicks or product video views, helps identify where users drop off.
Higher conversion rates show that engagement is translating directly into revenue and ROI.
Example: HubSpot has published data showing how A/B testing demo-request forms improved conversion rates by surfacing the shortest, most relevant fields.
Depth and Time on Task
Depth and time on task refer to session duration and scroll depth, showing how effectively content holds attention and whether users can complete their intended actions.
Longer, purposeful sessions are tied to stronger satisfaction, repeat visits, and higher lifetime value.
Example: Services like Spotify and Netflix use listening and viewing history to personalize recommendations. In the B2B world, platforms like Microsoft Teams or Slack apply the same principle — analyzing feature usage to drive adoption and retention.
Email Indicators
Measures that reveal the effectiveness of your email campaigns and subscriber engagement.
Open Rate
Open rate shows the percentage of delivered emails that recipients opened, reflecting the effectiveness of subject lines and sender identity.
Strong open rates are an early sign of healthy engagement, building the pathway to loyalty.
Click-Through Rate
Click-through rate (CTR) measures how many recipients clicked links in the email, indicating whether the content and call-to-action resonated with the audience.
High CTR means customers are not just reading but acting — a sign of deeper engagement and potential conversion.
Example: Salesforce Marketing Cloud case studies show that segmenting B2B audiences by account role can double CTR, because messaging speaks directly to buyer needs.
Unsubscribe and Spam Rate
Unsubscribe and spam rates reveal list health and the relevance of content. High rates can signal the need to adjust targeting or frequency.
Lower unsubscribe rates sustain customer relationships, protecting loyalty and lowering churn.
Social and Community Indicators
Signals of brand interaction, reach, and influence across social platforms and communities.
Engagement Rate per Post
Engagement rate per post tracks likes, comments, shares, and saves relative to impressions or followers, revealing which content resonates best.
High post engagement builds community trust and advocacy, fuelling referrals and long-term retention.
Example: IBM uses LinkedIn engagement data to evaluate thought-leadership campaigns, tying social performance directly to lead quality in enterprise deals.
Referral Traffic and Assisted Conversions
Referral traffic and assisted conversions measure whether social activity drives meaningful on-site behaviour, such as product exploration or form submissions.
When social activity drives conversions, it directly improves ROI and demonstrates the business impact of engagement.
Example: Adobe Experience Cloud highlights how webinars shared on LinkedIn drive both traffic and qualified pipeline, proving ROI beyond vanity metrics.
Satisfaction and Loyalty Indicators
Scores that reflect customer happiness, advocacy, and long-term retention strength.
CSAT by Channel
CSAT (Customer Satisfaction) is captured via short post-interaction surveys and reflects how happy customers are with a channel or process.
High CSAT scores signal loyalty in the making: satisfied customers are more likely to return, leave positive reviews, and strengthen brand reputation.
NPS and Themes
NPS (Net Promoter Score) measures advocacy and likelihood to recommend. Tracking verbatim feedback alongside scores highlights friction points.
Because promoters refer others and detractors churn faster, NPS is a direct indicator of how engagement drives both growth and loss.
Example: B2B manufacturers often benchmark NPS by product line to detect early warning signals of churn in their distribution networks.
Retention, Churn, and Repeat Purchase
Customer Retention, churn, and repeat purchase rates show the proportion of customers continuing to use the product or returning for additional purchases, offering a direct link to long-term engagement.
Each retained customer adds to Customer Lifetime Value (CLV), lowering acquisition pressure and compounding ROI over time.
➤ Supportbench tracks CSAT and NPS by channel in real time, so teams can identify which touchpoints drive satisfaction and which create friction—without juggling multiple tools.
Cost and Value Indicators
Financial measures connecting customer acquisition, value, and efficiency of growth.
Customer Acquisition Cost (CAC)
Customer Acquisition Cost (CAC) calculates the average cost of acquiring a new customer by dividing total sales and marketing spend by the number of new customers.
Tracking CAC keeps growth strategies efficient and ensures engagement tactics are sustainable.
Example: A logistics software provider optimized CAC by analyzing which digital touchpoints (whitepaper downloads vs. webinars) generated the most qualified leads.
Customer Lifetime Value (CLV)
Customer Lifetime Value (CLV) estimates the total revenue and margin a customer generates over their relationship with the company, often calculated as average purchase value × purchase frequency × average lifespan.
Rising CLV shows that engagement is producing loyalty, repeat purchases, and stronger profitability over time.
LTV:CAC Ratio
This ratio compares customer value to acquisition cost, helping teams assess the efficiency of growth initiatives.
When LTV consistently outpaces CAC, engagement efforts are directly driving ROI and long-term sustainability.
Tools and Techniques for Measuring Engagement
Here are the platforms and methods businesses use to track, analyze, and act on engagement data.
Core Analytics
Use GA4 (web), product analytics such as Mixpanel or Amplitude (feature usage, funnels, cohorts), and a data warehouse or CRM to tie activity to revenue. Align event names across platforms; the taxonomy is part of the product.
➤ Supportbench integrates with CRMs and analytics tools to unify web, email, and support data, giving a single view of engagement that ties activity directly to revenue.
Messaging and Email
Your email service provider will report opens, clicks, deliverability, unsubscribes, and complaint rates. Build lifecycle segments (welcome, trial, active, at-risk) so measurement aligns with customer intent.
Social and Listening
Native network insights cover reach and post-level engagement. Listening tools add mentions, share of voice, and sentiment so you can track how people talk about your brand compared with peers.
Satisfaction and Research
Survey tools should tag responses by channel and journey step. Pair scores with operational data—time to first response, first-contact resolution—so you can fix the cause, not just the score.
Impact of Digital Engagement on Loyalty and ROI
Engagement is not just about clicks or views — it’s a leading indicator of loyalty, retention, and profitability. When customers interact meaningfully early in their journey — reading content, completing key actions, and receiving timely support — they are more likely to stay, renew, and advocate for your brand.
Conversely, weak engagement shows up later as churn, negative reviews, and costly reacquisition campaigns. Customers who bounce quickly or abandon onboarding often become long-term losses.
The takeaway is clear: engagement metrics aren’t vanity numbers — they’re revenue signals. Strong engagement translates into higher customer lifetime value (CLV), healthier acquisition efficiency, and stronger advocacy. In other words, engagement directly drives loyalty and ROI.
➤ Supportbench links engagement metrics like session depth and ticket resolution to loyalty and CLV, helping companies prove the ROI of their engagement strategy.
Conclusion
Measuring digital customer engagement is about more than counting clicks — it’s about understanding which interactions drive satisfaction, loyalty, and long-term value. Businesses that connect engagement data to revenue and retention strategies are better positioned to thrive.
Supportbench brings these insights into one platform. By unifying CSAT, NPS, churn signals, and channel performance, it makes engagement measurement actionable instead of abstract. Teams can see what works, address gaps quickly, and prove the ROI of every customer interaction.
Ready to translate engagement into loyalty and growth? Book a free demo to see how Supportbench turns digital engagement into measurable success.